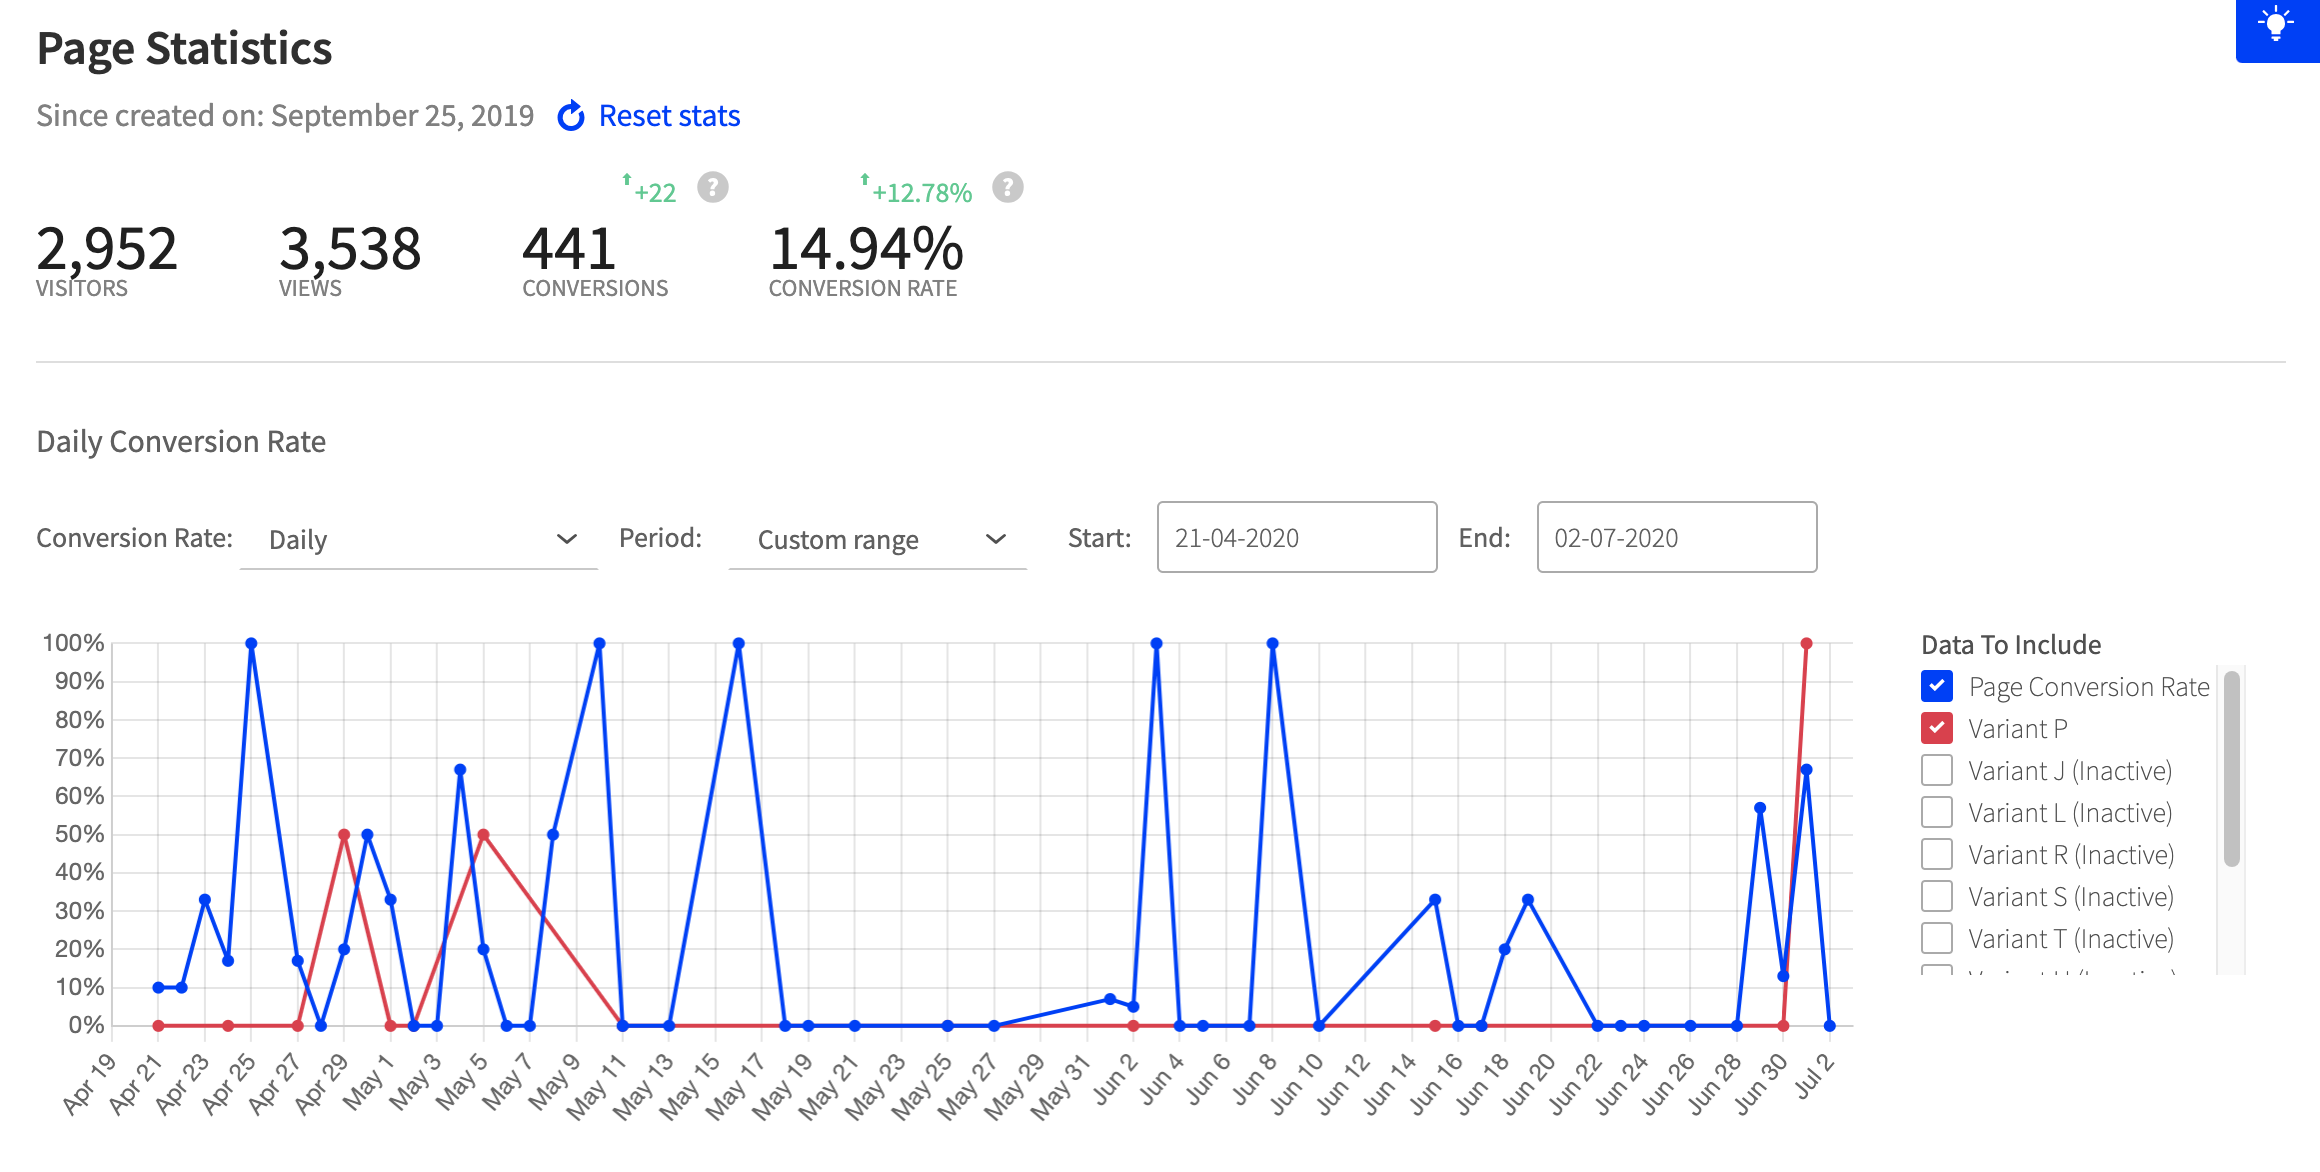
After publishing your page and collecting some traffic, you may want to review your page performance. The Page Overview tab provides aggregated statistics for visitors, views, conversions, and conversion rate along with a conversion rate chart giving visibility to your landing page and associated variants conversion rates over time.
Viewing your Page Statistics
- Log in to the Unbounce Platform, and click on a page from the All Pages screen to launch the Page Overview.
- Your Page Statistics will be right at the top displaying aggregated data for your landing page (including all variants) either from when your page was created, or since last stats reset date. See How Do I Reset My Page Variant Stats? for more information.
Using the Conversions Rate Chart
- Once on the Page Overview tab scroll down to the conversion rate chart.
-
On the right-hand side, navigate to the Data To Include tab to select a variant to review. You can select all active and inactive variants or choose specific ones:

Conversion Rate
Click the drop-down to view a Daily or 7 Day Rolling Average conversion rate: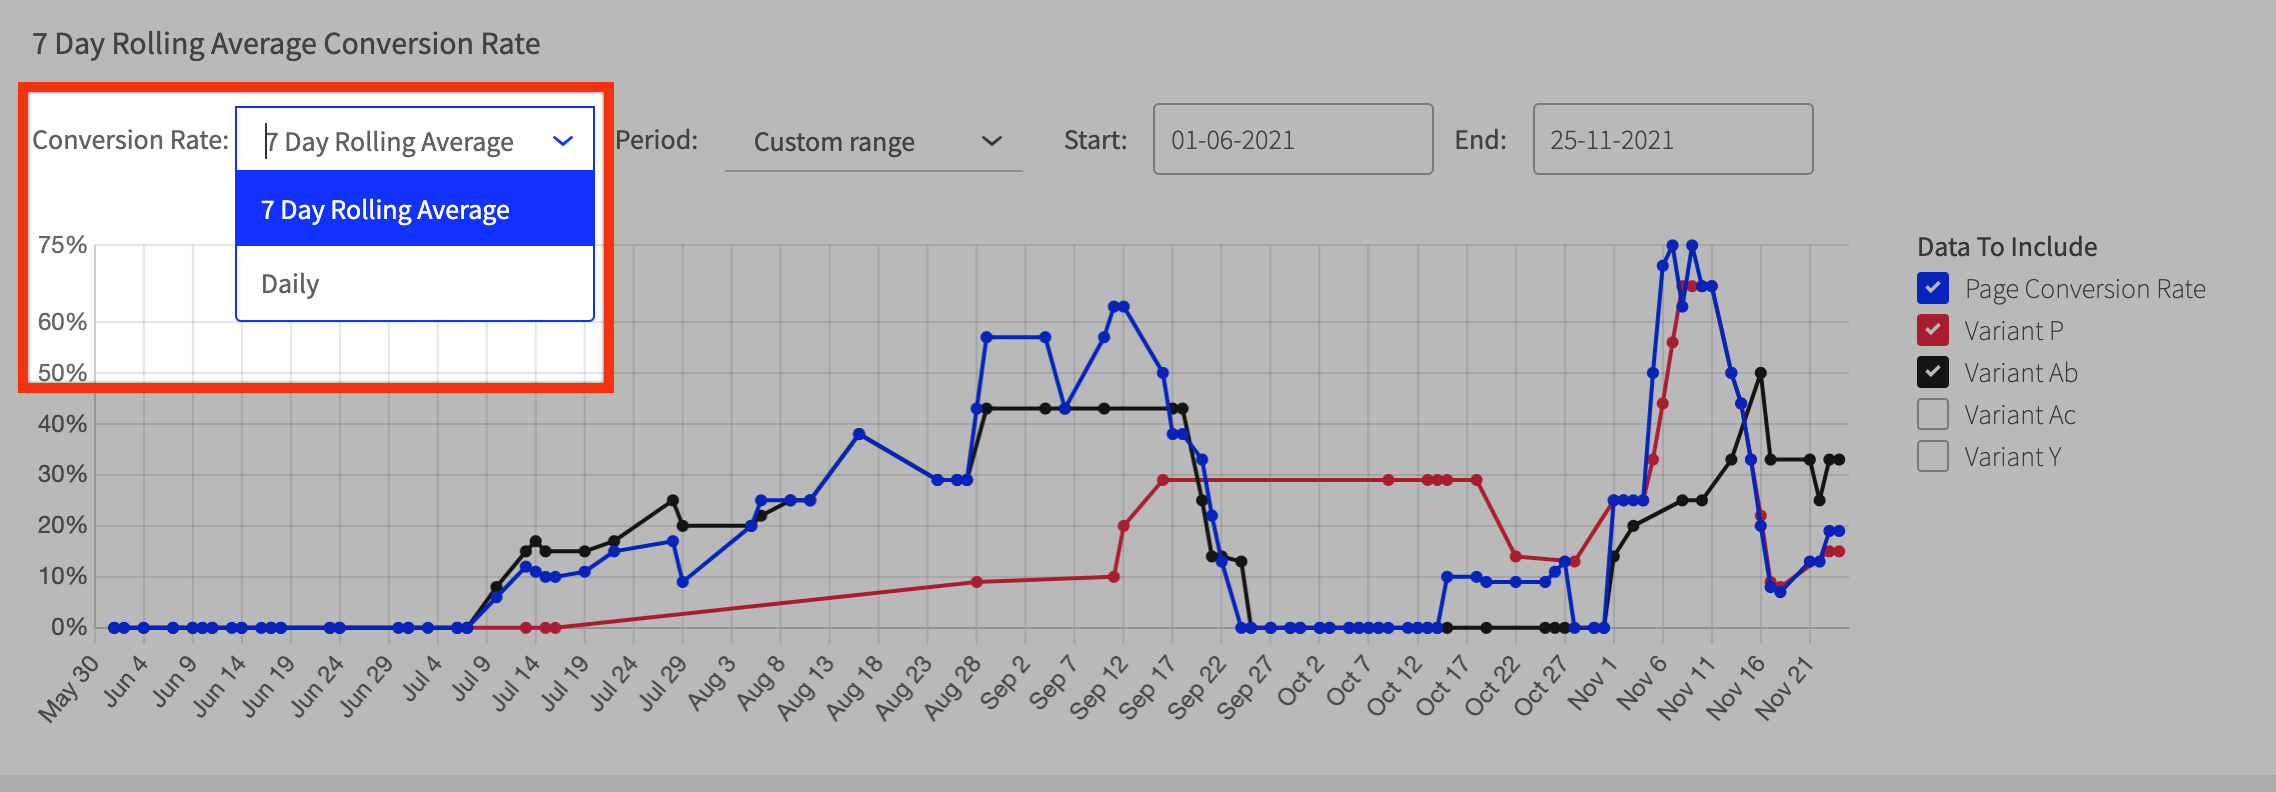
- Daily: the daily conversion rate (%) for your landing page variant(s).
- 7 Day Rolling Average: the average conversion rate across 7 days. This measure adds up the conversion rate over the course of 7 days, and calculates the average.
Time Period
You can specify a date range of data to view: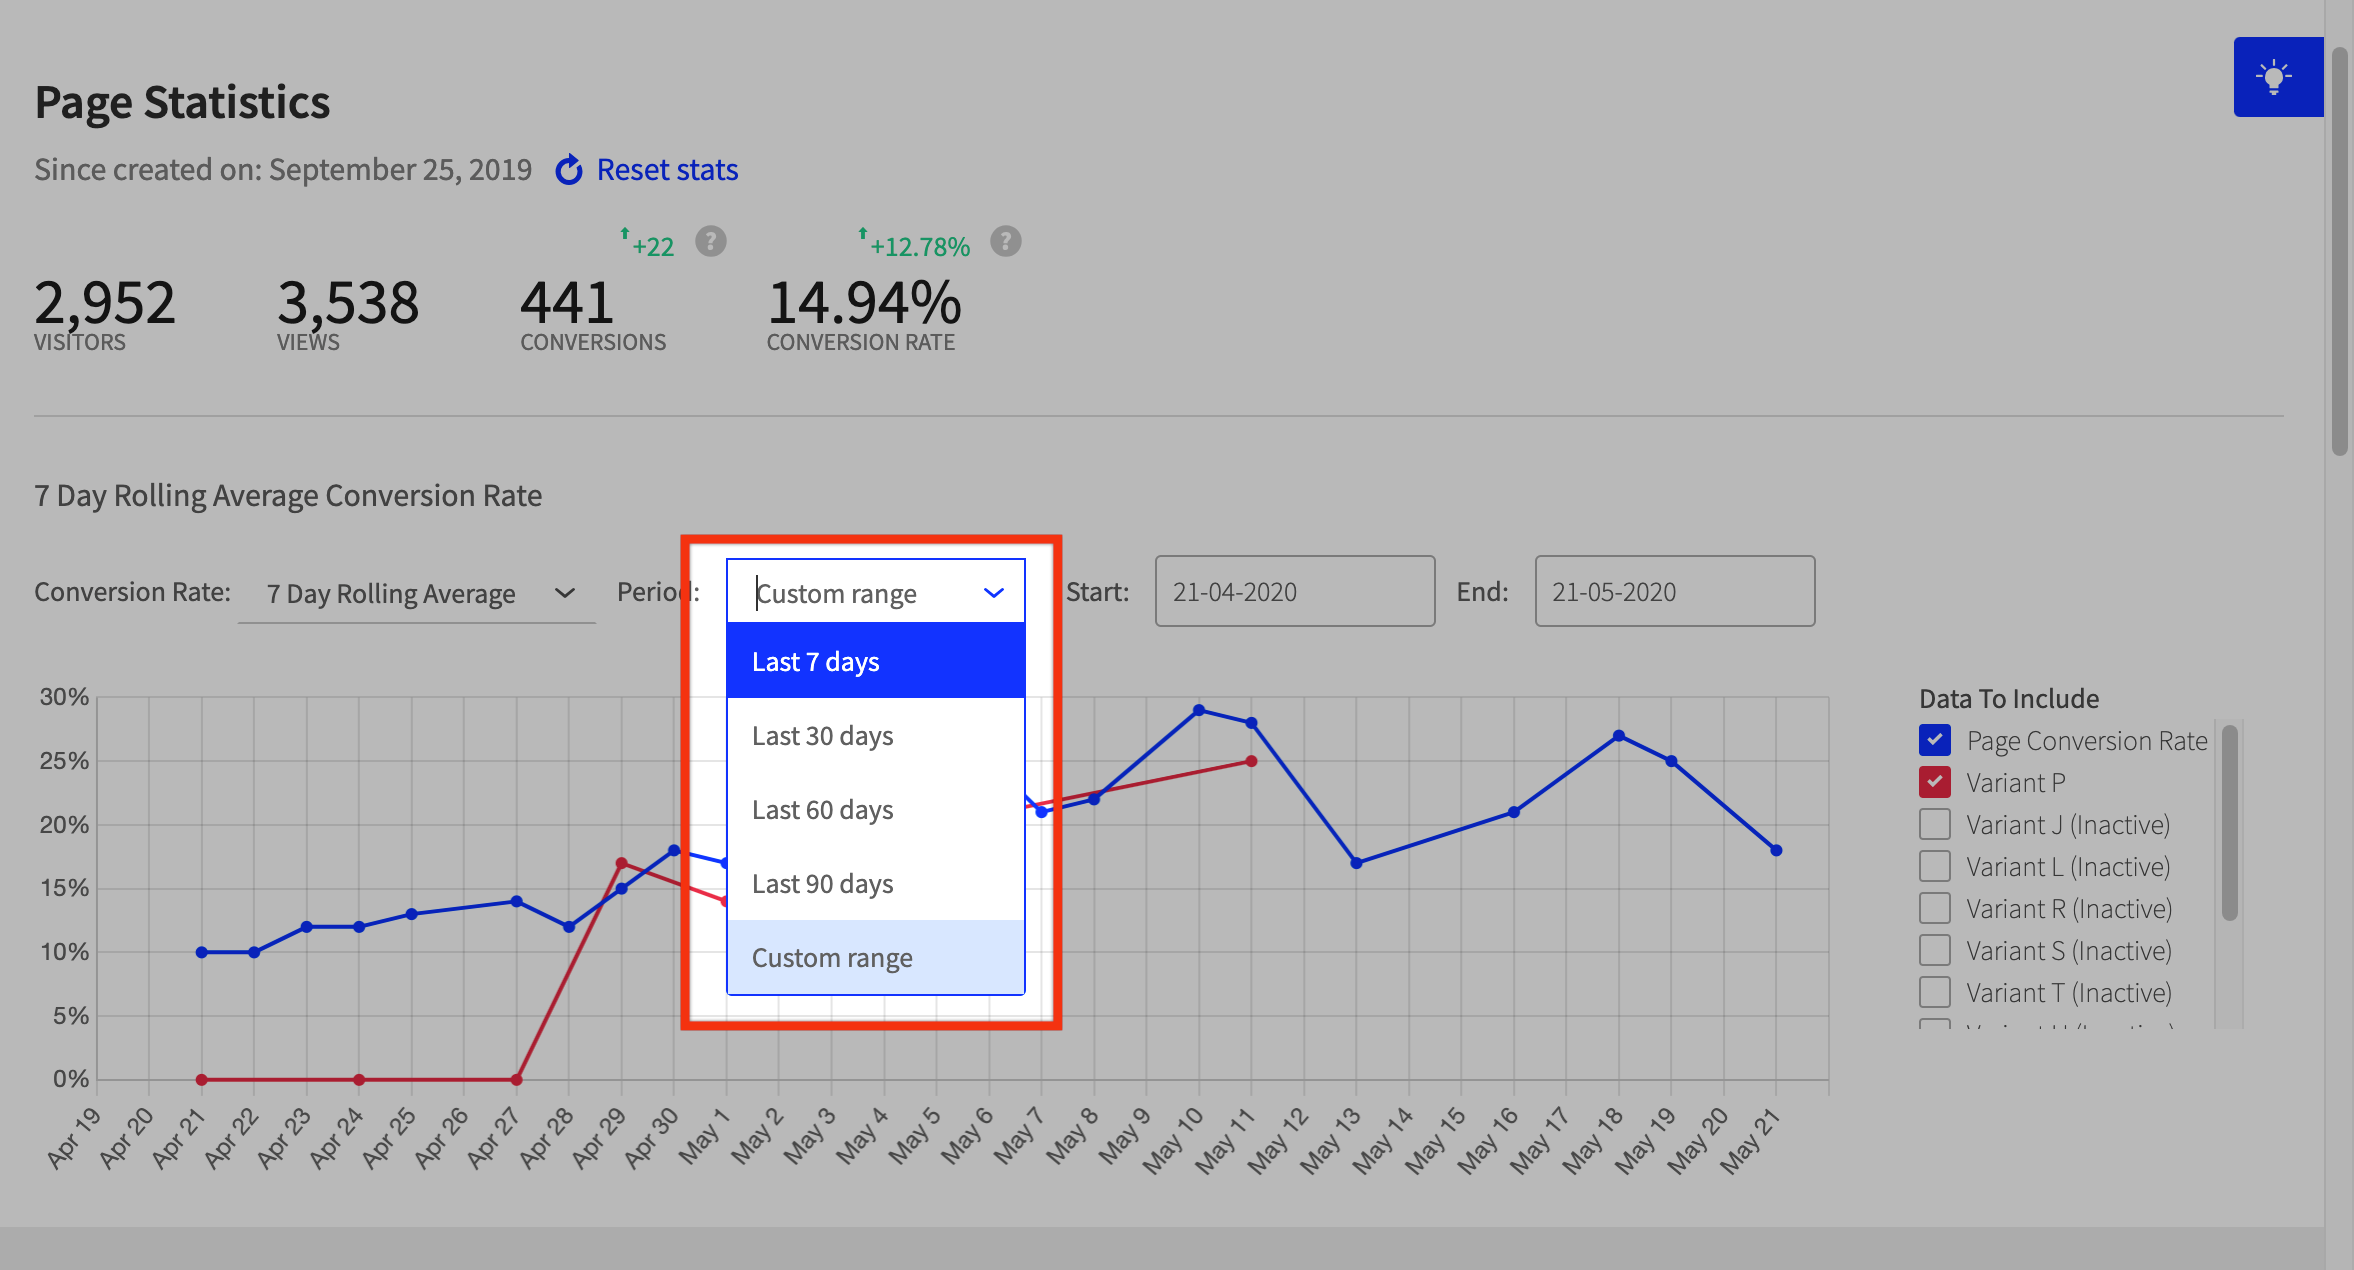
Select the last 7, 30, 60, or 90 days. You can also view conversion rates within a custom date range, up to one year only.
- For example, you can measure stats from January 1st, 2022 - January 1st, 2023, but not January 1st, 2022 - May 1st, 2023, as this is more than one year.)
Clicking one of the lines in the chart will show you cumulative stats over the selected date range: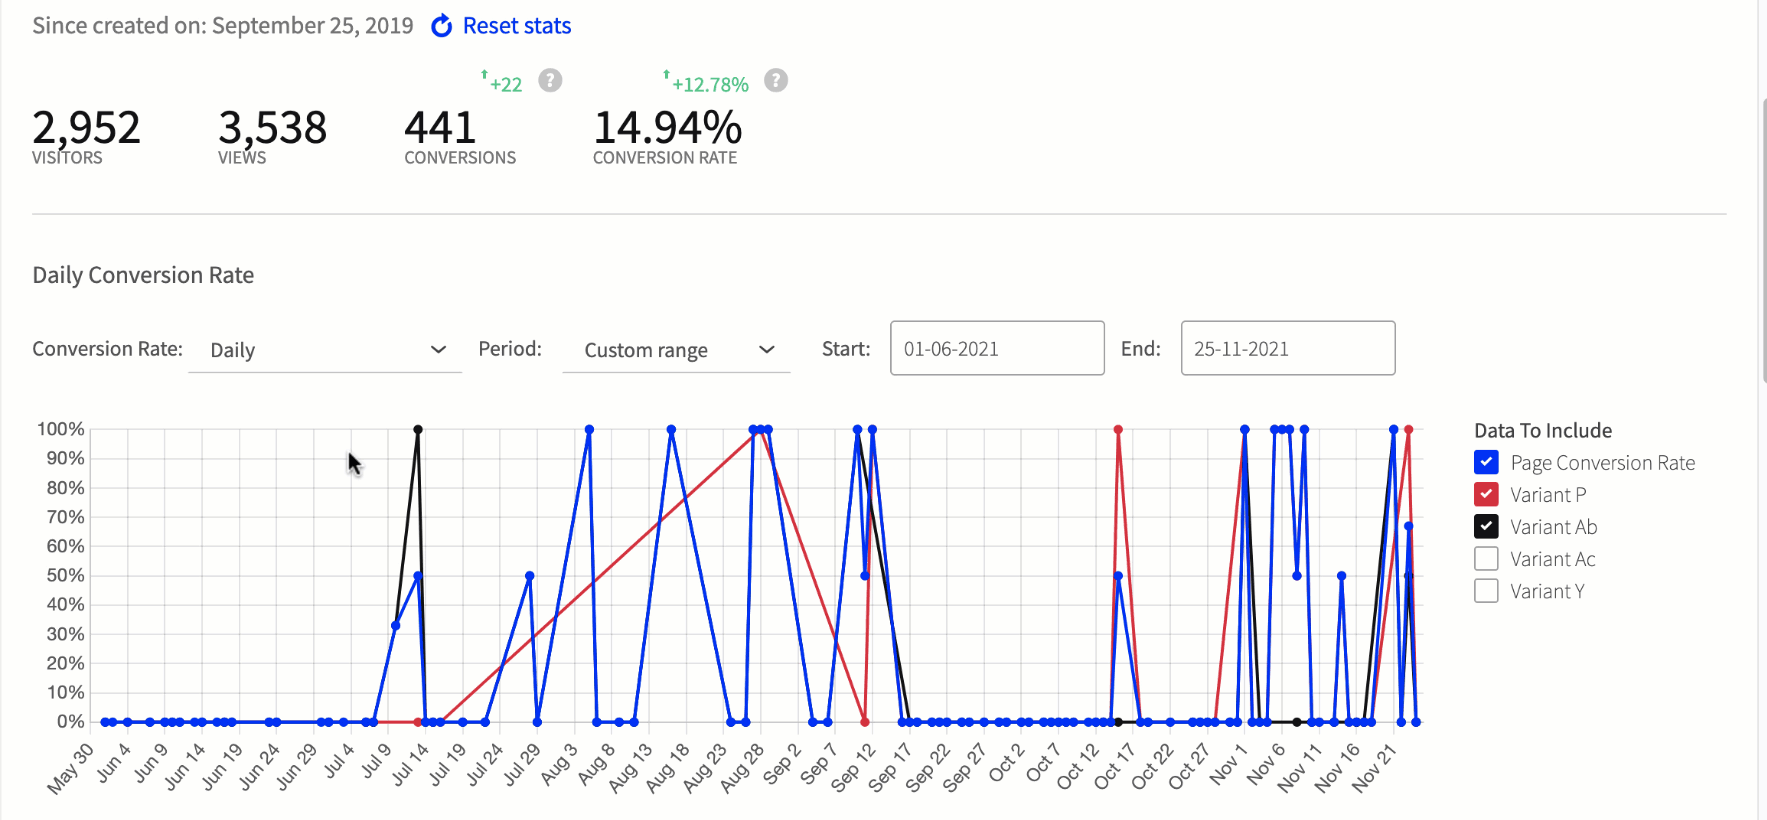
The conversion rate chart helps you analyze your page performance and conversion rates, giving you valuable insights to improve and enhance your landing pages.
Exporting Page Metrics
Select Export Chart from the Page Overview to export your chart data as:
- A PNG
- A CSV

For both charts, you can export the currently displayed data for the selected:
- Chart Type: Daily Conversion Rate or 7 Day Rolling Average
- Date Range: Currently Selected Date Range for the chart
- Variants: Currently selected variants
Related Articles